Alexander Björling, DLSR7 conference
Summary
TLDRАлекс, ученый на луче Nanomax в Max4, рассказывает о применении когерентного потока, доступного на луче, благодаря четвертому поколению учебного кольца. Nanomax, старший из лучей, предоставляет сфокусированные и когерентные лучи высокого качества. В лаборатории используются два конечных станка: дифракционный, расположенный вниз по течению, и станция для изображения, которая находится на стадии разработки. Когерентный луч обеспечивает нанофокусировку, удобен для определения и выравнивания оптики. В видео обсуждаются практические преимущества когерентного луча, его использование для улучшения нанотомографии и новые эксперименты, возможные благодаря высокому когерентному потоку, такие как 3D-стресс-имагинг наночастиц при катализе. Алекс подробно объясняет, как высокой когерентный поток позволяет проводить более точные и быстрые эксперименты, а также рассматривает проблемы, с которыми сталкиваются при работе с малыми наночастицами, и как они решаются.
Takeaways
- 🏗️ НаноМакс - один из первых лучей, запущенных на MAX4, работает с 2017 года и предоставляет фокусированные и когерентные лучи высокого качества.
- 🛠️ Устройство спроектировано для работы в диапазоне между 6 и 30 кВ, с акцентом на когерентный поток.
- 🔍 НаноМакс имеет два конечных станка: дифракционный и станк для изображения, который в настоящее время строится.
- 📐 Дифракционный станк основан на зеркалах KB для фокусировки и установлен на гранитной пьедестале.
- 📊 Для определения когерентного фокуса используется технология тихографии, которая позволяет вычислить комплексную волновую фронт проба.
- 📈 Фокусировка с когерентным лучом обеспечивает высокую резолюцию и точность в экспериментах.
- 🚀 Высокая когерентность позволяет проводить исследования, которые ранее считались невозможными, такие как 3D-нанотомография.
- 🔬 В экспериментах с наночастицами, таких как катализаторы, можно измерять деформацию наночастиц во время их функционирования.
- 📉 С увеличением размера образца для нанотомографии требуется больше когерентного потока, что обусловлено полиномиальным соотношением.
- 🔬 Использование высокого когерентного потока позволяет улучшить качество изображения и уменьшить время эксперимента.
- 🔧 В работе с наночастицами возникают проблемы с неконтролируемым вращением частиц под действием луча, что требует разработки новых методов обработки данных.
- 🌟 НаноМакс продолжает развивать технологии для работы с более малыми наночастицами и повышения когерентного потока для оперативных экспериментов.
Q & A
Чем является устройством Nanomax?
-Nanomax является одним из первых лучей, запущенных на MAX4, и с 2017 года находится в эксплуатации. Это единственный длинный луч в лаборатории, длиной 100 метров от источника до образца. Это жёсткий рентгеновский луч, работающий между 6 и 30 кВ.
Какой тип луча используется в экспериментах на Nanomax?
-На Nanomax используется когерентный луч с высококачественным когерентным потоком, который позволяет проводить фокусированные и когерентные лучи с высоким качеством.
Какой тип зонда используется в нанотомографии на Nanomax?
-В нанотомографии на Nanomax используется зонд с высокой когерентностью и интенсивностью, что позволяет получать более высокие разрешения и быстрее выполнять трехмерное изображение.
Какой тип детекторов доступен на Nanomax?
-На Nanomax доступны различные детекторы, включая встроенные детекторы в вакуумном трубопроводе, детектор Браге, установленный на роботизированной манипуляторной системе, и детектор флюоресцентного излучения, расположенный ближе к образцу.
Какой тип зонда используется для выравнивания оптики луча?
-Для выравнивания оптики луча используется технология тихографии (tychography), которая является когерентным изображением, позволяющим получать комплексную передачу образца и комплексную волновую фронт проба.
Чему пропорционально разрешение в нанотомографии?
-Разрешение в нанотомографии полиномиально зависит от когерентного потока, и этот показатель обычно равен 1/5, что означает, что улучшение разрешения требует значительного увеличения когерентного потока.
Какой тип эксперимента был проведен с использованием высокого когерентного потока?
-С использованием высокого когерентного потока был проведен эксперимент с измерением напряжения на одном молекуле катализатора, используя технику Bragg CDI (когерентного дифракции Браге) для изображения напряжения на отдельной наночастице.
Какой масштаб используется для измерения размера частиц в эксперименте с Bragg CDI?
-В эксперименте с Bragg CDI изучались частицы в диапазоне от дюймов до десятков нанометров, что значительно больше, чем частицы, используемые в реальных катализаторах топливных элементов, размер которых составляет 2-5-10 нанометров.
Какой метод был использован для сбора и анализа данных о движении наночастиц?
-Для сбора и анализа данных о движении наночастиц был использован метод максимальной правдоподобности (maximum likelihood method), позволяющий собирать когерентные объемы дифракции из неконтролируемых траекторий движения частиц.
Каковы были результаты эксперимента с движущимися наночастицами?
-В результате эксперимента удалось собрать и восстановить когерентные объемы дифракции, а также восстановить траектории движения наночастиц, а также изучить распределение напряжения на них с разрешением около 10 нанометров.
Какие будут следующие шаги в исследовании с использованием высокого когерентного потока?
-Следующие шаги включат переход к изучению меньших частиц, получению максимального когерентного потока на эти частицы и проведению эксперимента вoperando (в рабочем режиме), например, в электрохимическом реакторе или клетке.
Outlines
🔬 Введение в NANOMAX и его применение
Алекс, ученый NanOMAX инструмента на MAX4, представляет NANOMAX как один из первых лучей, запущенных в 2017 году. NANOMAX - это длинный жёсткий рентгеновский луч с напряжением между 6 и 30 кВ. Инструмент разработан для предоставления фокусированных и когерентных лучей высокого качества. Обсуждаются два конечных станка: дифракционный и визуализационный, последний в стадии разработки. Также рассказывается о том, как луч описывается, сосредоточен и каким образом используется для различных экспериментов.
📡 Практические преимущества когерентного луча
Автор объясняет важность когерентного луча для создания нанофокусированного изображения, а также для выравнивания оптики. Когерентное изображение используется для выравнивания зеркал KB с помощью технологического метода тихографии, который позволяет получить комплексную волновую функцию образца и волновую фронт. Обсуждаются также практические и удобные аспекты использования когерентного луча, включая улучшение нанотомографии благодаря высокому когерентному потоку.
🚀 Инновационные эксперименты с когерентным лучом
Алекс рассказывает о новом типе экспериментов, возможных благодаря высокому когерентному потоку, включая Bragg CDI (когерентное дифракционное имиджасирование) для измерения напряжений в отдельных наночастиках в процессе катализата. Обсуждаются эксперименты с изображением напряжений на никелевых пористых образцах и преодоление технических трудностей, таких как неконтролируемое вращение наночастиц под действием интенсивного луча. Рассказывается о разработке методов для сбора и анализа данных с движущимися наночастицками.
🔍 Выводы и дальнейшие направления исследований
Алекс подводит итоги своего выступления, отмечая достижения и перспективы развития технологий NANOMAX. Он упоминает ожидаемые улучшения в области нанотомографии и планы для дальнейших экспериментов с меньшими наночастицами и вoperando условиях. Завершает свою речь благодарностью команде NANOMAX и организаторам конференции и приглашает всех к общению и вопросам.
Mindmap
Keywords
💡когерентный поток
💡Nanomax
💡лучепровод MAX IV
💡синхротронное излучение
💡когерентное изображение
💡тихография
💡нанотомография
💡когерентный дифрактный томография (CDI)
💡энергетическое зависимость
💡флуоресцентный детектор
💡операндо
Highlights
Alex, a beamline scientist at Nanomax, discusses the utilization of coherent flux at the beamline due to the fourth-generation storage ring.
Nanomax is one of the first beamlines at MAX4, operational since 2017, and is a hard X-ray beamline operating between 6 and 30 kV.
The instrument is designed to provide focused and coherent beams with an emphasis on coherent flux.
There are two end stations at Nanomax: a diffraction end station and an imaging end station currently under construction.
The diffraction end station uses fixed KB mirrors for focusing and is mounted on a goniometer on a granite slab.
The end station is designed for a flexible sample environment, allowing users to bring their own holders, reactors, or cells.
A variety of detectors are available, including inline detectors and a Bragg detector mounted on a robot arm.
The beam is well described with a flux of a fully coherent beam, at least two times 10 to the power of 10 photons per second at 10kb.
Diffraction-limited focusing is established with an energy-dependent spot size, typically around 100 nanometers at normal operating energies.
Coherent beams are crucial for providing a nano focus and are convenient for characterizing and aligning optics.
Coherent imaging techniques like typography are used for KB mirror alignment.
Incremental progress on the state of the art can be made with high-quality flux, such as in coherent imaging for nanotomography.
High coherent flux allows for faster and better coherent imaging, potentially leading to qualitative leaps in experimental capabilities.
A recent project involved in operando Bragg CDI imaging of catalysts, aiming to image the strain of a single nanoparticle during catalysis.
The challenge is the scaling of signal with particle size, which requires a significant increase in flux for smaller particles.
A practical problem is nanoparticle rotation under intense illumination, which can disrupt controlled experiments.
Maximum likelihood methods have been used to assemble coherent diffraction volumes from movies of particles moving uncontrollably.
The resolution achieved in the project is estimated to be around 10 nanometers, with the next step being to move to smaller particles.
The ultimate goal is to perform in operando experiments with smaller particles in an electrochemical reactor or cell.
Transcripts
hi everyone
uh my name is alex i am one of the
beamline scientists
at the nanomax instrument of max4
and i will be talking today about how we
use
the coherent flux that we have available
at the beam line
thanks to the fourth generation storage
ring
so let me spend just a few minutes
introducing the beamline
to you so nanomax is
one of the first beamlines actually to
come online at max4
we've been in user operation since 2017.
it's the only long beam line that we
have at the lab it's 100 meters
source to sample it's a hard
x-ray uh beamline which means we operate
between 6 and 30 kv
usually between them sort of 8 and 15.
and the instrument is designed to
provide
focused and coherent beams of high
quality
with emphasis on coherent flux
we have two end stations at nanomax one
which is in operation now
the diffraction end station located all
the way downstream here
and a second imaging end station which
is
being built now and which will hopefully
come online next year
here's an overview of the diffraction
and station
um it builds on fixed
kb mirrors for focusing and the whole
setup sits on a diffractometer or on a
goniometer
here on this big granite slab
the end station is designed to have a
relatively open and flexible
sample environment so that users can
come with their own
holders or reactors or cells as
illustrated here
and we have a variety of detectors
available so we have
inline detectors in this vacuum tube and
on this
on this detector table here we have a
brag detector mounted on this robot arm
and there's also fluorescence emission
detector sitting closer to the sample
our beam is relatively well described by
now we have a
flux of a fully coherent beam um
which is at least two times 10 to the 10
photon per second 10kb and we've
established that
diffraction limited focusing work so we
have
an energy dependent spot size which is
usually around
100 nanometers of normal operating
energies
i'm not going to say much more about the
beam line now
but if you would like any details
on the setup or ask any questions about
possible experiments
please check out our website or contact
me or any of my colleagues at nanomax
okay so coming to how we utilize the the
coherent plugs that we have access to
um i'd like to divide this question up
into
four different levels ranging from the
sort of trivial and practical
things to more exotic consequences of
having high quality flux so first of all
we do need
a great beam to provide a nano focus in
the first place regardless of whether we
then use the clearance of that beam
for the experiment um it turns out that
it's very
convenient to work with a coherent beam
in terms of characterizing it
and aligning the optics
we can of course make incremental
progress on the current state of the art
so we can do things like coherent
imaging for example
faster or better than what was possible
before
and then i think that we all hope that
there will be qualitative leaps so that
things that were not
possible at all before suddenly are
and i am not the person to say what
those new
types of experiments will be but uh
towards the end of this talk i'll
present a recent pro
a recent project of my own where we look
at
nanoparticles in in new ways
okay so starting with the practical
benefits of of having a coherent beam
as i said we do need a beam to provide a
nano focus
at all so we work with different
diffraction
limited focusing um here's a sketch
of one of our kb mirrors from the side
now the intensity profile that this
focus beam will have
in the focal plane will be proportional
to this squared sync function here
and you can see in the argument that we
have the the numerical aperture which is
the
the width of the mirror uh divided by
the
focal length of the mirror and of course
the beam
has to be coherent across this whole
aperture
um to see this we can imagine dividing
the beam in two
each half of the beam illuminates half
of the mirror
and if we then imagine that these two
sub beams are mutually incoherent of
course
to get the the new focus we would add
these two incoherently so we do an
intensity sum
of two beams each now with half the
numerical aperture
and you can just see that that means
that the sync function will be
half as fast and it will just have
um twice the width okay so
it doesn't matter if we're doing a
coherent imaging experiment
we still need the coherence to produce
the diffraction limited focus
it's also as i mentioned very convenient
to work with a coherent
beam and one of the
ways we we do this is that we use
coherent imaging in the form of
typography
to do our kb mirror alignment
so tychography is a coherent imaging
technique
where we scan a sample through the beam
and by phase retrieval we we get the
complex transmission function of the
sample and we also get the full complex
wavefront of the of the probe
right so we have the beam and phase and
amplitude in a particular plane
and we can propagate that numerically
along the optical axis and then simply
look at the beam
from the sides look at the intensity
distribution from the top and from the
side
and see where the focal are so in this
instance
the two mirrors they don't agree on a
focal plane
which is why the beam looks sort of fun
we have an astigmatic
focus now with our kb mirrors we can
simply adjust the pitch angles of the
mirrors to make them
focus in the same plane we repeat
typography repeat this numerical
exercise
and we now see that we have a stigmatic
focus
where both mirrors look at the same
plane
and we have a nice intensity
distribution
in focus now it's the same here it
doesn't matter if we're actually doing a
coherent
imaging experiment with this beam it's
still very good to have access to the
intensity profile
in the sample plane even if you're doing
for example
scanning fluorescence imaging
so moving beyond the practical and
convenient aspects of having a coherent
beam
let's look at how we can make
incremental progress on the state of the
art of the field
and here i'm going to use coherent
imaging nanotomography
as an example so just for comparison
um i've written down the
what i believe anecdotally is that is
the typical
operating fluxes at two leading
current imaging beam lines in the world
namely po6 et petra
and the sea stacks at the swiss light
source so they typically work in the mid
10th to the 7th whereas as i mentioned
at nanomax we we have what we consider
to be a fully green beam that's 2 times
10 to the 10. so it's a tremendous
step up and flux
now of course these facilities are
upgrading and i haven't even included
the esrf
ebs bmis which are currently in
operation
um but i mean it shows you that we're
looking at a huge
increase in coherent drugs
so what can we do with this in the case
of nanotomography
so there's a trade-off in nanotomography
between resolution
the volume of the sample that you can
look at and the time that this takes
and i've written this down as a sort of
rough scaling relation here
where you can see that the coherent flux
scales inversely with the
time taken for the experiment
and it's also linear scaling between
current flux and
sample volume so that's simple
but if we look at how the resolution
scales
the size of a resolution element in 3d
um actually scales polynomially with
coherent flux and this exponent
is typically like 1 over 5 so it's
pretty expensive
and that means that it's it's not
trivial to achieve
arbitrary resolution just by cranking up
coherent flux right
it is a little bit complicated in
reality of course you do
something between you maybe maybe you
look at
a slightly bigger sample and you do it
slightly quicker
and you get a slightly better resolution
right but i wanted to show this just to
hammer in this point that resolution is
actually really really expensive in
terms of flex
and then of course in reality you
typically have
practical limits in terms of scan speed
overhead
the computing power that you need to
keep up
with a fast experiment the
ability of your sample to tolerate the
intense beam and so on
but of course you can certainly improve
on nanotomography by having
a high appearance so we've been working
towards this
slowly at nanomax this is an example
from my colleague mike
kant who has imaged here
a metallic porous nickel sample
in three dimensions this is done with a
preliminary detector
setup that we've moved on from now so
it's
slightly dated but it shows you where
we're trying to go
so in this experiment mike was able to
use
very short exposures right thanks to the
high chain flux that we have
and what came out was a quantitative
quantitatively correct electron density
in three dimensions
and the resolution limits were well well
behaved so
that means that we understand where the
2d resolution comes from and where the
3d resolution comes from
now this experiment also uncovered
experimental bottlenecks so we had an
inefficient
way of scanning the sample detector
readout was expensive at this point
and we barely kept up with the phase
retrieval of the compute cluster
so we've been working on these practical
aspects quite a lot actually since this
came out
um and i hope that we will be able to
provide a new
benchmark um soon
okay so turning towards experiments that
that were not possible before
i'm going to use a recent project of my
own as an example of this
and it comes from inoperando brag cdi
imaging of
catalysts so the idea here is that you
use
bragg cdi which is a 3d strain imaging
technique
and you image the strain of a single
nanoparticle
as it performs a catalytic function
ideally that would involve absorption on
the surface
that would in turn produce strain in the
underlying lattice
which you could then detect and get
these types of
strain maps or indirect reactivity maps
of single
nanoparticles this was pioneered at the
aps
bmi 34 idc and it's also been done
at the p10 beamline and petra 3.
the problem so far is that there's a
massive gap between the types of
particles that you can study
with brexit the eye and the types of
particles that
are actually relevant for example in
fuel cell
catalysis so particles imaged are on the
hundreds of nanometers
length scale and particles in real
fuel cell catalysts are on the order of
two
five ten managers um
that's okay in principle right because
brag cdi doesn't have an inherent
resolution limit but since the signal
drops quickly with particle size
you can really see how flux or coherent
flux will be important here
looking at the maths it unfortunately
turns out
that the total
counts in a single detector frame
is proportional to the particle diameter
to the fourth
power so it's pretty steep scaling that
we're looking at here
it basically means that if we were to go
from 300 nanometers to 30 nanometers we
would have to pay
a factor of 10 000 in signal
so it's a good idea that we we have a
lot of new current products available
a practical problem here is that um
also work uh pioneered at at bmi 34 idc
the aps
showed uh that under intense
illumination nanopartic nanoparticles
actually
rotate and that can be because of
radiation pressure because of
temperature
but they do they do rotate so in this in
an ideal experiment you would actually
um move by a small rocking rotation you
would move your bracket through the
detector plane in a controlled and
smooth way
but what happens in reality is that the
particle just swings around here
and because this experiment has a high
angular sensitivity
um it's just a completely uncontrolled
experiment
we saw this at nanomax so we looked at
60 nanometer gold particles and we saw
them
going through these uncontrolled
spontaneous rocking curves
we saw this in many instances it just
happened all the time so the beam is
really pushing the particle around
and of course as we make particles
smaller and we make beams more intense
this is going to become more and more of
a problem
so the idea here is
that we'd like to take these movies and
just actually piece them together
and to form coherent diffraction volumes
out of them
so this is the same type of sketch again
instead of moving this diffraction
volume through the detector plane
there are now unknown trajectories in
two angles which
which this bag peak follows
and the question is can we piece this
together to form a coherent diffraction
volume
i won't go into the details here but we
solved this problem in analogy
with a different problem encountered in
free electron lasers
and cdi so this is worked by dwayne lowe
and more recently thomas
where they use maximum likelihood
mechanization to
assemble coherent diffraction volumes
so we did this we got this out in
december in
mprl and
again without going into the details
what we do is that we start with these
movies of particles moving on controller
b
we use the maximum likelihood uh method
that this paper describes to put
together these current diffraction
volumes
then by the way we get the angular
trajectories out so we can actually
reconstruct how the particle was
moving which i think is fantastic and
then sorry
we can use normal phase retrieval
software
in this case pinex from the href
to to retrieve our particles so in this
case we
very clearly retrieve this envelope of
the particle which was a truncated
octahedron which you can see here
and looking at the strain which is what
we're really interested in
several particles gave very similar
strain distributions
on this scale you have a positive strain
around the waist
and two negative poles top and bottom so
this is
very consistent and uh the resolution
is estimated to to somewhere around
10 nanometers so the next step here is
of course to move to
smaller particles get as much green flux
as we can
on these smaller things uh then put this
in an electrochemical
reactor in a cell and do the whole thing
in operando so hopefully we'll be back
with more results on that
okay my time is up um thanks to the
whole uh
nanomax team to everyone involved in the
spontaneous rocking curve work the
organizers of this
of this event for allowing me to talk
get in contact with me have a look at
our website
and get back to me with any questions
that you have
and i'll join you for the questions
session
thank you very much
4.8 / 5 (33 votes)


7 ПОЛЕЗНЫХ устройств на АРДУИНО, которые можно собрать за 15 минут.

Искусственный Интеллект в Юриспруденции: Как нейросети применяют юристы

Эта стратегия сделала меня финансово независимым! Smart Money

How we KNOW the dates for the Old Testament!

Гайд. ЗАБЫТАЯ ИМБА! ЛОВУШКА ДЛЯ КАЛАШИСТА в раст раст строительство как построить
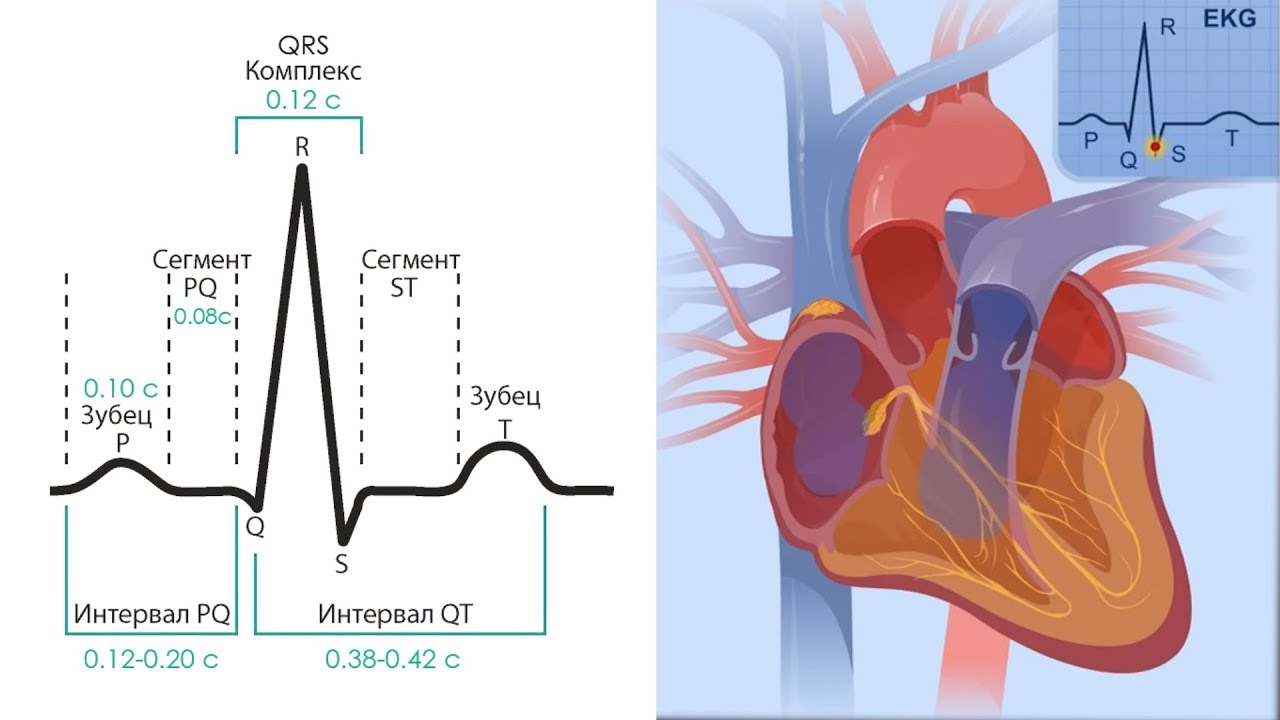
Основы ЭКГ за 100 минут | Проводящая Система Сердца | Зубцы, интервалы, сегменты на ЭКГ